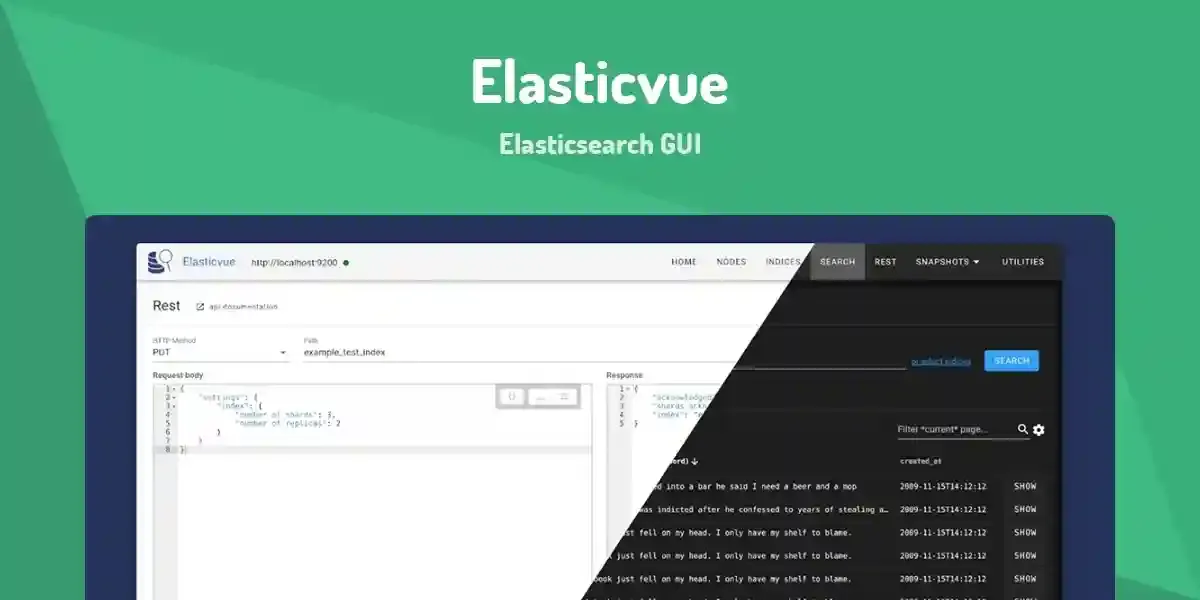
Unlock the Power of Elasticsearch: The Ultimate Guide to Elasticvue
Elasticsearch has revolutionized how we handle data at scale, powering everything from e-commerce search to log analytics. Yet despite its immense capabilities, interacting with Elasticsearch through raw REST APIs or command-line tools feels like navigating a dark maze with a flickering flashlight. This is where Elasticvue transforms your experience - a free, open-source GUI that illuminates your Elasticsearch cluster management like never before.
Whether you're a DevOps engineer troubleshooting shard allocation, a developer debugging document mappings, or a data analyst crafting complex queries, Elasticvue delivers an intuitive visual interface that turns complexity into clarity. Compatible with all Elasticsearch versions (including EOL releases), it bridges the gap between raw cluster operations and human-centric usability.
Why Elasticvue Stands Out: Core Features Explained
🎯 Cluster Intelligence Dashboard
Instantly visualize your cluster's health with color-coded status indicators, node distribution heatmaps, and real-time metrics. Identify hot nodes before they overload and track resource allocation across your infrastructure.
⚙️ Index & Alias Management
Create, delete, or reindex data stores in two clicks. Configure aliases with drag-and-drop simplicity and visualize index relationships through interactive dependency graphs - no more guessing games with curl commands.
🔍 Document Explorer
Search across indices using natural Lucene syntax or JSON queries. Edit documents inline with syntax highlighting and validation. Reindex individual records during debugging without full cluster operations.
📊 Shard Optimization Tools
Visually map shard distribution across nodes, identify unbalanced allocations, and initiate rebalancing operations. Monitor recovery progress after node failures through live status trackers.
🛠️ REST Query Interface
Build and save API requests with auto-complete, variable substitution, and response formatting. Test aggregations, security roles, or pipeline definitions without leaving the interface.
💾 Snapshot Management
Configure repositories, trigger backups, and restore clusters through guided workflows. Schedule snapshots visually with retention policy management.
Getting Started: 5 Ways to Deploy Elasticvue
1️⃣ Desktop App (Recommended)
For maximum performance without CORS headaches:
Pro Tip: Desktop builds auto-update and bypass browser security restrictions.
2️⃣ Browser Extensions
Embedded directly into your workflow:
3️⃣ Docker Deployment
Preconfigure clusters for team access:
docker run -p 8080:8080 -e ELASTICVUE_CLUSTERS='[
  {
    "name": "Production",
    "uri": "http://es-prod:9200",
    "username": "admin",
    "password": "SECURE_PASSWORD"
  }
]' cars10/elasticvue
4️⃣ Web Version
Instant access without installation:
👉 https://app.elasticvue.com
5️⃣ Self-Hosted Solution
For air-gapped environments:
git clone https://github.com/cars10/elasticvue.git
npm install
npm run build
# Deploy /dist contents to your web server
Critical Configuration: Enabling CORS Access
Skip this if using desktop app or browser extensions
Step 1: Edit elasticsearch.yml
http.cors.enabled: true
http.cors.allow-origin: "http://localhost:8080" # For Docker
# OR
http.cors.allow-origin: /https?:\/\/app.elasticvue.com/ # Web version
http.cors.allow-headers: X-Requested-With,Content-Type,Content-Length,Authorization
Step 2: Docker Environment Variables
docker run -p 9200:9200 \
  -e "http.cors.enabled=true" \
  -e "http.cors.allow-origin=/.*/" \
  docker.elastic.co/elasticsearch/elasticsearch:8.9.0
Step 3: Restart cluster and verify:
curl -XGET 'localhost:9200/_cluster/settings?include_defaults=true&flat_settings=true' | grep cors
Real-World Use Cases
🔥 Incident Response Scenario
When logs stopped indexing in a production cluster:
- Used Shard Allocation view to identify UNASSIGNED shards
- Discovered disk threshold breaches via Node Statistics
- Temporarily adjusted
cluster.routing.allocation.disk.threshold_enabledvia Rest Interface - Triggered rebalancing after emergency cleanup
🔄 Blue/Green Deployment
- Created
products_v2index with new mapping - Used Alias Management to switch
current_productsalias - Verified traffic shift via Index Metrics dashboard
- Deleted old index after 24-hour verification
🔍 Mapping Debugging
- Found documents rejecting ingestion
- Used Document Explorer to sample problematic records
- Tested new mapping with REST Query tool
- Reindexed with correct mapping via Index Operations
Troubleshooting Guide
Common Issues & Fixes
Connection Refused
- Verify network access between Elasticvue host and ES cluster
- Check Elasticsearch
network.hostsettings
CORS Errors
- Confirm
http.cors.allow-originmatches your deployment URL - Ensure headers are included:
Authorization, Content-Type
Authentication Failures
- Test credentials with
curl -u user:password http://es-host:9200 - Enable audit logs:
xpack.security.audit.enabled: true
Reset Nuclear Option:
- Open Elasticvue Settings
- Click "Disconnect and Reset"
- Re-add clusters
Ecosystem Comparison
| Feature | Elasticvue | Kibana | Cerebro | Head |
|---|---|---|---|---|
| EOL Version Support | ✅ | ❌ | ⚠️ | ✅ |
| Document Editing | ✅ | ❌ | ❌ | ⚠️ |
| Docker Preconfig | ✅ | ❌ | ❌ | ❌ |
| Snapshot Management | ✅ | ✅ | ❌ | ❌ |
| REST Client | ✅ | ⚠️ | ❌ | ❌ |
| No X-Pack Dependency | ✅ | ❌ | ✅ | ✅ |
Detailed comparison: Elasticvue vs Other Frontends
Localization & Extensibility
Elasticvue speaks your language:
- English, Chinese, French, Russian, Japanese, Italian
Contribute Translations:
# Add new locale file
src/locales/ru.json

# Register in src/boot/i18n.js
const messages = {
  ru: require('./locales/ru.json')
}
Build Custom Plugins:
Leverage Vue.js architecture to:
- Add custom dashboard widgets
- Integrate authentication providers
- Develop proprietary index templates
Ethical Open Source Model
While Elasticsearch transitioned to SSPL licensing, Elasticvue remains truly open-source under MIT license. Maintained through:
- GitHub Sponsorships
- PayPal Donations
- Community contributions
Design Inspiration for Developers
Discover endless inspiration for your next project with Mobbin's stunning design resources and seamless systems—start creating today! 🚀
Explore 150,000+ screens from top apps with filters for:
- Elasticsearch dashboard patterns
- Admin panel UX flows
- Data visualization techniques
Conclusion: Modernize Your Elastic Stack
Elasticvue transforms Elasticsearch from a cryptic backend service into a visual, interactive data platform. By eliminating the friction of command-line operations and fragmented tools, it enables:
- Faster troubleshooting with visual cluster analytics
- Reduced errors through guided operations
- Cross-team collaboration via intuitive interface
- Future-proofing with version-agnostic compatibility
Your next steps:
- Install the desktop app
- Join 12k+ developers in the GitHub community
- Contribute translations or plugins
"Elasticvue is to Elasticsearch what pgAdmin is to PostgreSQL - an indispensable management cockpit that should ship with every cluster." - DevOps Lead, Fortune 500 Tech Company


